服务治理——监控
本篇将演示如何简单的搭建起整个监控平台。当前服务主要使用语言为Go,所以下面均用Go作为后端服务。
看下服务治理的大概定义:
1、服务注册与发现。
2、可观测性。
3、流量管理。
4、安全。
5、控制。
那监控就属于服务治理中的可观测性——常见的包括监控(Metrics)、日志(Logging)、调用追踪(Trace)。而本篇则是着重讲述监控这一点。
服务在运行时,会产生很多数据指标(CPU、内存占用,QPS等),而这些数据的产生则可由服务本身记录,例如发送一个HTTP请求,就加1,与逻辑无关,却又是与数据相关的搜集代码就是埋点操作。普通服务状态下,我们使用微服务框架去封装以及分层这一步操作。
框架
对常见协议的Metrics收集,HTTP/GRPC。
目前业务上使用的是Go-Micro,不过Go-Micro没写HTTP的指标收集,这个比较简单,需要自己添加一下,使用gin自带的也可以。
服务组件
使用docker-compose将服务一次性全部启动。
在docker-compose.yml中加入,钉钉通知插件。
1 | #钉钉插件 |
Token从钉钉群里的自定义机器人中获取
另外注意,dingtalk组件版本为v1.4.0,v2版本后此启动方式将报错。V2版本使用。
‘config.yml’ does not exist, try --help
alertmanager/config.yml修改:
1 | route: |
prometheus的配置文件中,指定了alertmanager的地址,以及报警规则的文件位置:
1 | # Load and evaluate rules in this file every 'evaluation_interval' seconds. |
alert.rules文件:
1 | groups: |
grafana需要饼图插件的话,可以下命令获取:
1 | https://grafana.com/grafana/plugins/grafana-piechart-panel/ |
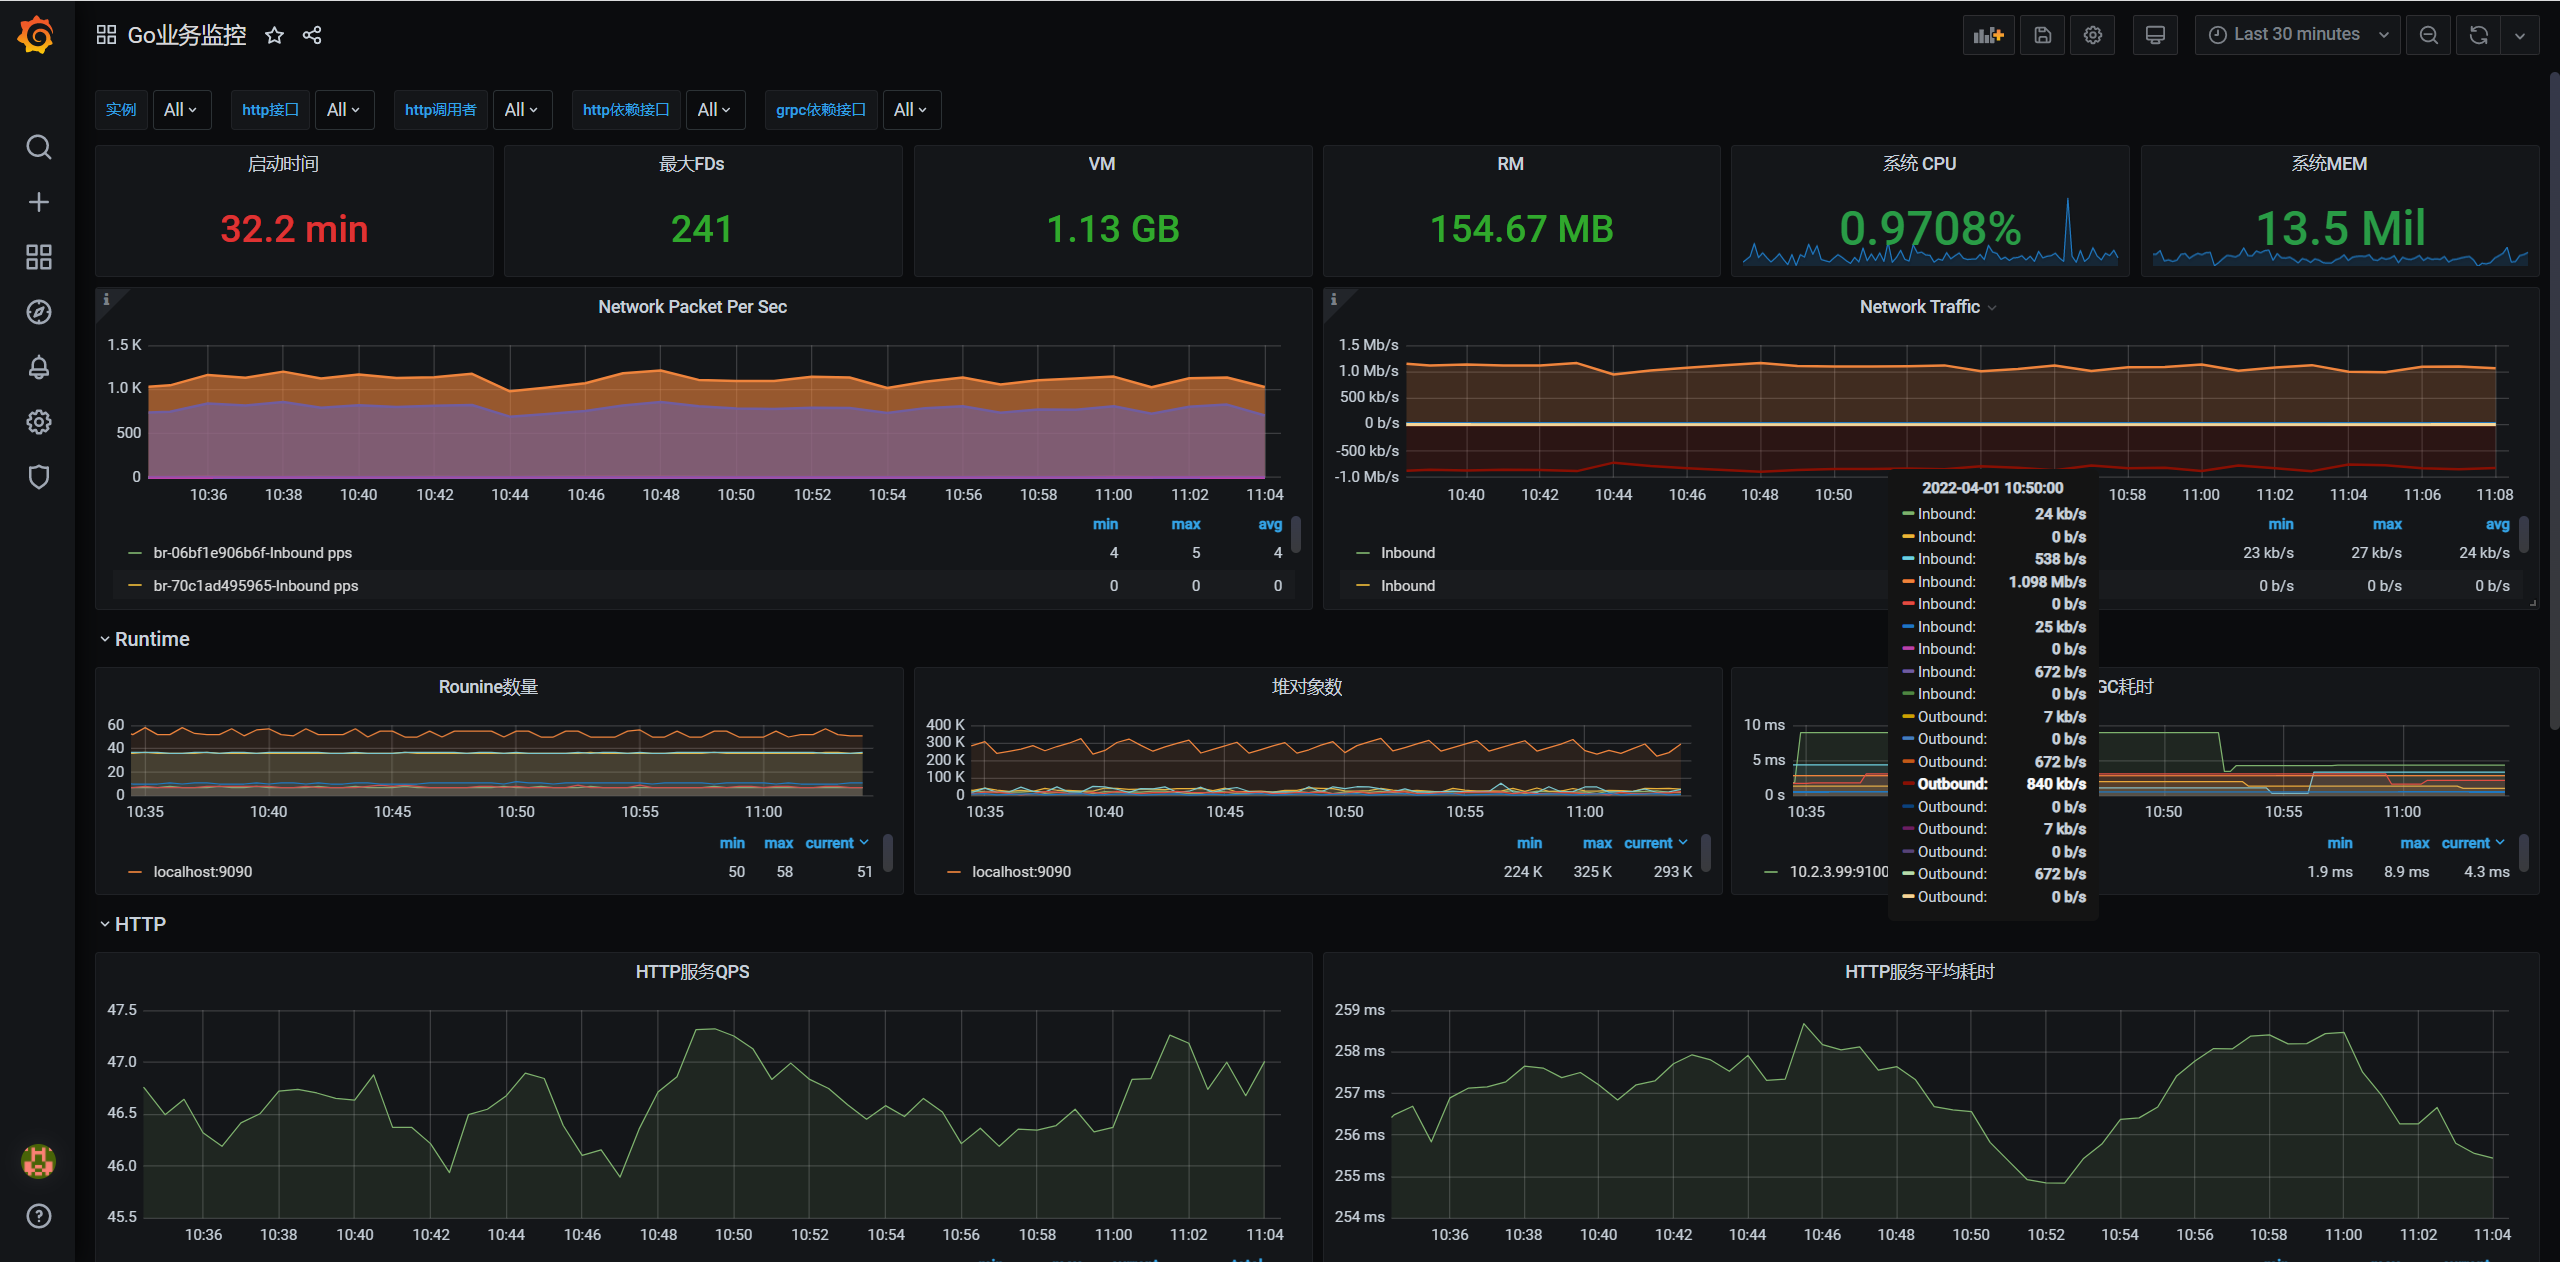
结果
展示
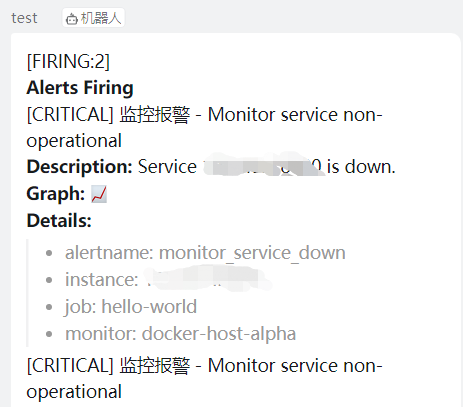
报警
资料
prometheus服务自发现,不需要手动去修改文件,指定prometheus的监控程序。
https://prometheus.io/blog/2018/07/05/implementing-custom-sd/
prometheus服务发现实现:https://github.com/fabxc/prom_sd_example
非常全的对prometheus各组件采集的文档:https://erdong.site/prometheus-notes/
P95、P90的值都比较重要,是查看接口性能的一个重要指标。
本文标题:服务治理——监控
文章作者:小师
发布时间:2022-04-06
最后更新:2022-05-04
原始链接:chunlife.top/2022/04/06/服务治理——监控/
版权声明:本站所有文章均采用知识共享署名4.0国际许可协议进行许可